Posts

Showing posts with the label Incorta

Using Github to version and manage notebooks(Jupyter notebooks)

Image
Version Control and Manage is a vital part of data science workflows. Between multiple experiments, it is essential to know what changed and which updates were made by which team member. We can use Github to version and manage notebooks(Jupyter notebooks) following the below steps.  Step 1: Go to the Incorta environment at the terminal.  $ ssh -i <key file> incorta@<IP address> Step 2: Find Jupyter file path follow below command: $ cd / $ find . -name '*.ipynb' -print We can see the Jupyter notebooks file path is /home/incorta/Notebooks Step 3: Go to Github, create a new repository.  Step 4: Then clone this link under the Notebooks directory. $ git clone https://github.com/SuzieJi/Jupyter-Notebooks We can see the folder in Jupyter notebooks. Step 5: Go to the git repository directory that we cloned from Github.  $ cd < directory >/ Git config (When the first time) $ git config --global user.name "xxx" $ git config --global user.email "xxxxx...

Read parquet file via data lake connector in Incorta

Image
Incorta allow to read parquet file, this is how to read parquet file via data lake connector in Incorta.  Step 1: Save the parquet file in external notebooks(Jupyter notebooks) Step 2: In Incorta external data source, Add a new data source. Step 3: Select 'data lake - local files', give directory path. Step 4: Go to Incorta Schema add a new data lake table.

How to do data profiling in Incorta

Image
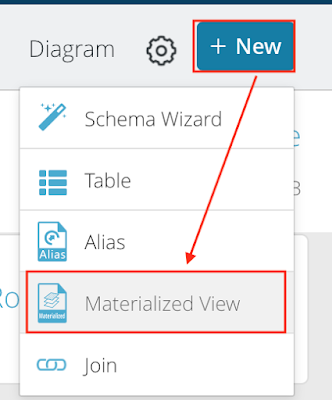
Sometimes we need to better upstanding about data, we can do data profiling using Spark Python in Incorta. Firstly, Add a new Materialized View in Incorta. Select Spark Python. Then, I have two methods do data profiling. Method 1: Using df.describe()  This function can provide min, max, count, mean, stddev. But only for data types of string and number.  Method 2: Calculate each metric ourselves.  Below is the syntax:  

How to create fiscal calendar in Incorta?(Part 4)

Image
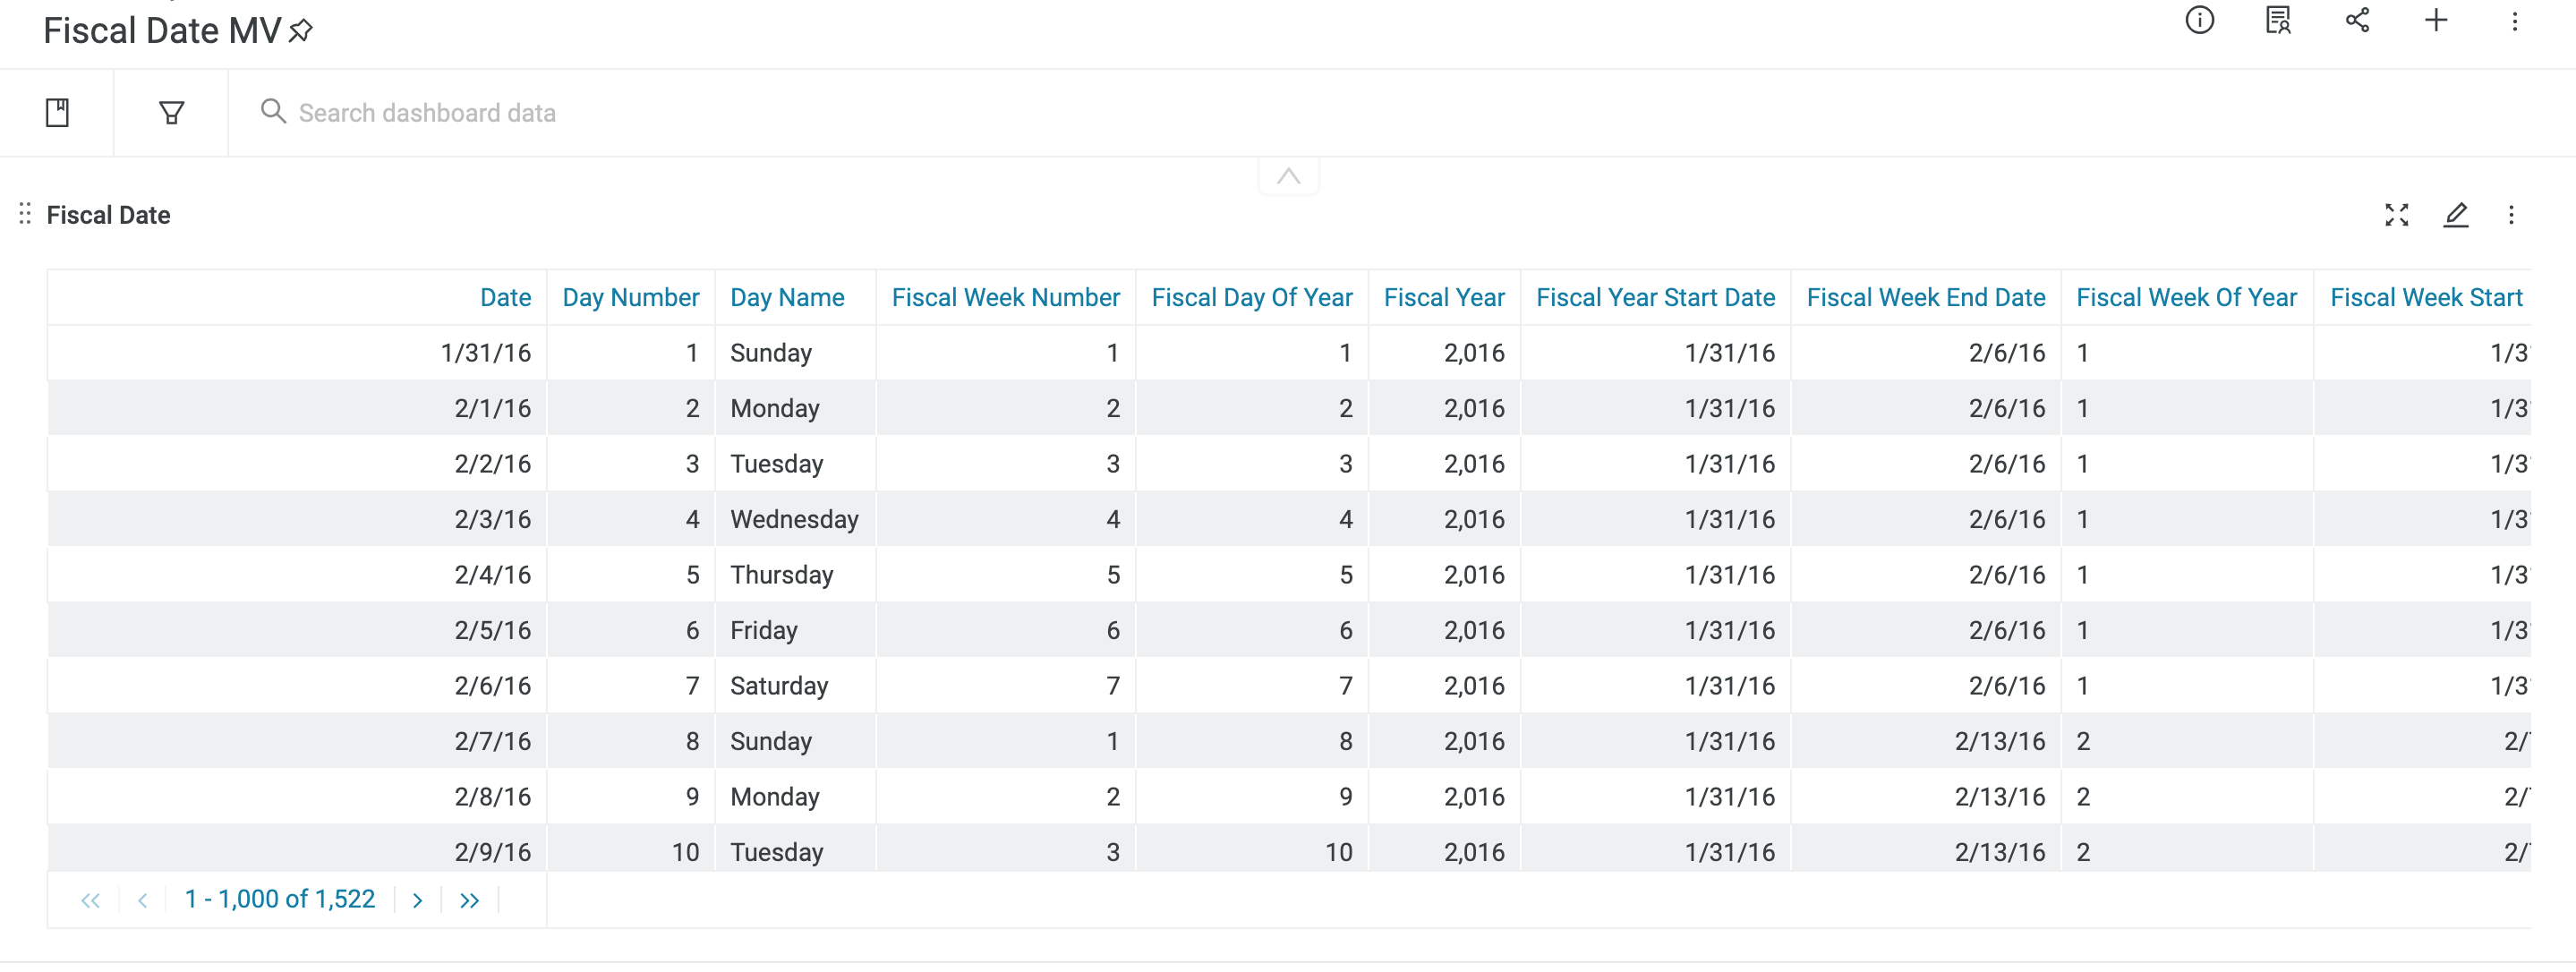
 This part is about the holiday. I have two columns, holiday name, and day type. Use Spark SQL to complete. Below is a screenshot of the dashboard in Incorta. For more details, please see my previous blog. https://suziepyspark.blogspot.com/2020/10/using-pyspark-to-get-holidays-in-incorta.html

How to create fiscal calendar in Incorta?(Part 3)

Image
 The third part is the PySpark dataframe, this part is the most challenging part for me. Writing this part with PySpark is simpler and easier since we can get the data we want based on the previous result. For example, fiscal quarter seq and fiscal week of quarter can be built on the top of fiscal quarter number, and so on. I also practice how to use the window function in dataframe. For example, calculating fiscal year end date, fiscal month start date, fiscal month end date, and so on.  For getting the fiscal quarter number, we can use divide the week of year by 13.  For getting the fiscal month of quarter, we can depend on the fiscal week of quarter. When fiscal week of quarter <= 4, it is the first month of the quarter, and the month of quarter is 1. When fiscal week of quarter <=4+5, fiscal week of quarter is 2.  When fiscal week of quarter <=4+5+4, fiscal week of quarter is 3. Otherwise, when there are more than 52 weeks in a year, fiscal week of ...

How to create fiscal calendar in Incorta?(Part 2)

Image
This is the second part of the fiscal calendar MV, the Spark SQL part, through this part we can get day number, day name, fiscal week number, fiscal year start date, fiscal week end date, fiscal week of year, fiscal week start date, fiscal day seq, fiscal week date, fiscal day seq, fiscal week seq, fiscal year seq, fiscal day ago date, fiscal week ago date.  Divide the day of the year by 7, and if the remainder is 0, the week number is 7, which represents Sunday. Other week numbers are remainders.  Pushing the current date backward the days of the year is the fiscal year's start date.  To get the fiscal week of year. floor((doy-1)/7) . divided day of the year by 7 and remove the decimal. To get the fiscal week end date, first I get the fiscal week of the year floor((doy-1)/7) , and get the current number of days from the last day of the week through (((floor((doy-1)/7))+1)*7)-doy , then returns the week end date that is the num days after the date date_add(date, num_...

How to create fiscal calendar in Incorta?(Part 1)

Image
I will refer to the fiscal calendar from the National Retail Federation and create the same fiscal calendar in Incorta. https://nrf.com/resources/4-5-4-calendar First, I created a materialized view using PySpark in Incorta. You can click this link to see how to use PySpark to create a materialized view in Incorta.  https://community.incorta.com/t/x1jhfc/creating-materialized-view-using-pyspark In the python part, I generated the fiscal year according to the number of days within a year.  In a week based fiscal calendar, a year can have either 52 or 53 weeks. I use the number of weeks and the days of year to determine the start of years. This is the first part of the fiscal calendar. It is now a dataframe with three columns. the 'idx' column with the sequence number, 'doy' column with the day of the years, and 'fiscal year' column.  In the second part, I will explain how to get the data we need such as fiscal_week_number, fiscal_year_start_date, fiscal_week_of_y...

How to create histogram in Incorta use bin function.

Image
The  Ecommerce_Customer schema has four variables, Time On App, Time On Website, Length Of Membership, and Yearly Amount Spent. I want to see the distribution of these data. Incorta let me preview the data and show max and min data of each using its Preview function. Here are the steps I used to create a histogram in Incorta. First,  I used the bin function in Incorta divided into different levels. Here is the documentation for the bin function.        https://docs.incorta.com/4.5/r-bin Here is the result of the bin function. I divided the average of session length into 6 levels. If the length is less than 30, it will be labeled as 'SLV1', and if the length is greater than 30 but less than 32, it will be labeled as 'SLV2', by basically, according to the min and max value. I see the minimum value is close to 30, and the maximum value close to 38. I decided to use 2 minutes as the interval and created the formula using the bin function. I'm grouping...

Using Incorta and PySpark Linear Regression ML package to predict eCommerce Customer

Image
Project Overview I got a dataset from  kaggle.com .  Assumption: eCommerce company based in New York City that sells clothing online but they also have in-store style and clothing advice sessi ons. Customers come into the store, have sessions or meetings with a personal stylist, then they can go home and order either on a mobile app or website for the clothes they want. We need to predict 'Yearly Amount Spent' Here are the features or attributes collected in the dataset: 'Avg__Session_Length' 'Time_on_App' 'Time_on_Website' 'Length_of_Membership' Step 1: Upload csv file in incorta. Upload the CSV file to Incorta, and add a file table in the schema named Ecommerce_Customer. Step 2: Read the Ecommerce Customer file Use PySpark to read the table named SparkTesting.Ecommerce_Customer. The CSV file loaded into Incota can be read into PySpark using  df=read("SparkTesting.Ecommerce_Customer") Step 3: VectorAssemblerTest Use...

How to convert date to 'yyyymmdd' format in MV

Image
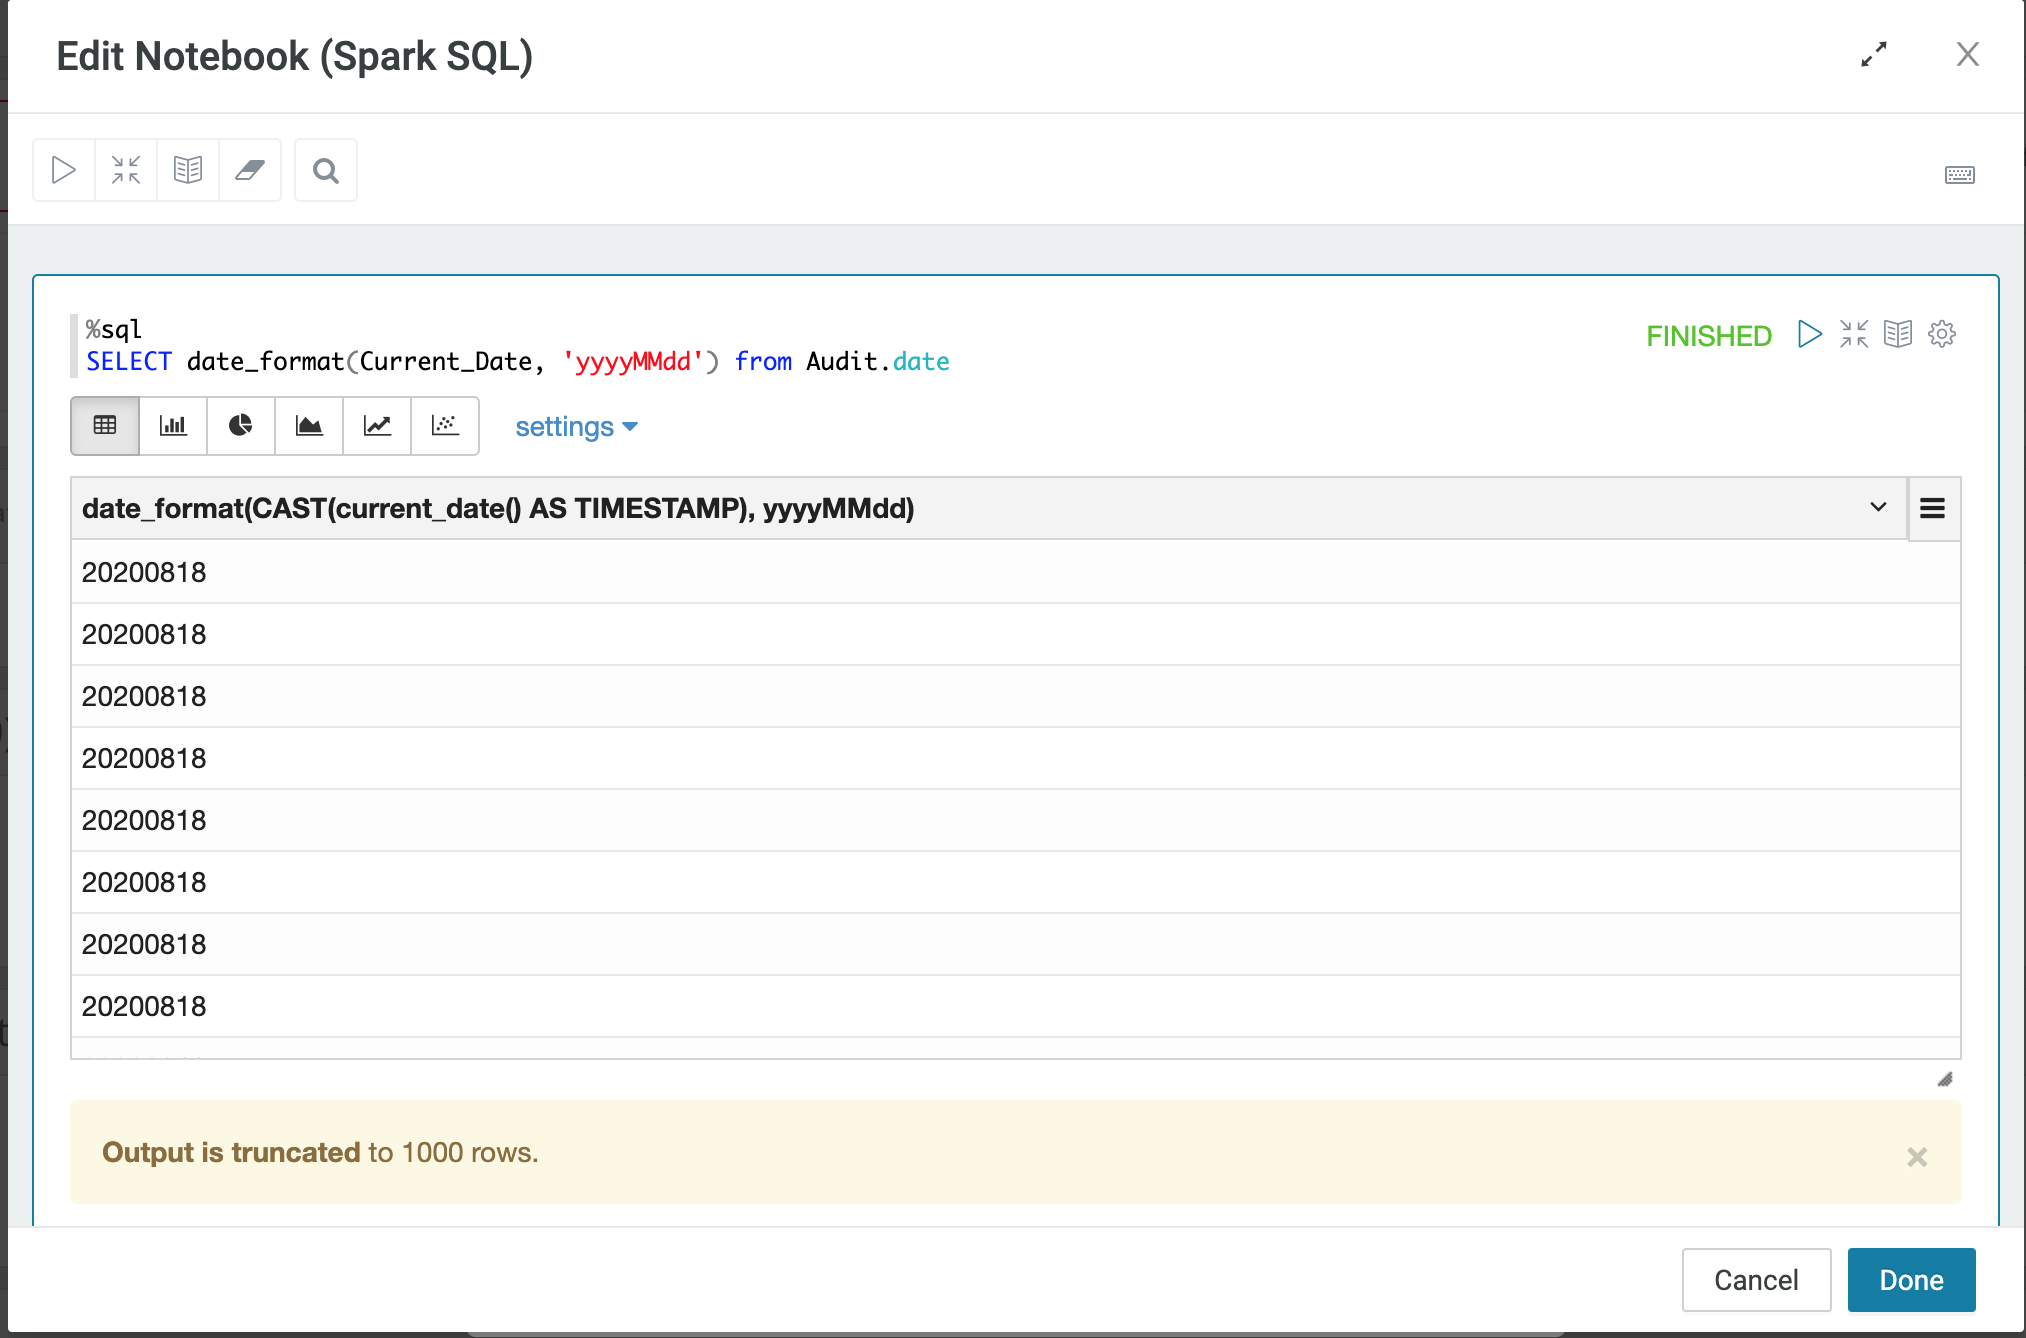
 I got this question from  community.incorta.com .  Question:  I want to convert CURRENT_DATE to format 'yyyyMMdd' in the materialized view,  I try CONVERT, and FORMAT function but it's not supported in SQL of MW, how I can do that?  Answer:

Verify Primary Key in Incorta

Image
I’m not sure what is the primary key of a table, for example, this Orderitems table. Here is how I verified. My assumption is that an order can have multiple items and an item will be listed once an order. By grouping Orderitems with orderNumber and productCode, we should get one row per group. If we got more than one row, we can conclude that the combination of orderNumber and productCode is not unique. The result shows that no data returned. This verifies my assumption is true.