Using Time Series Analysis Electric Production by FB Prophet
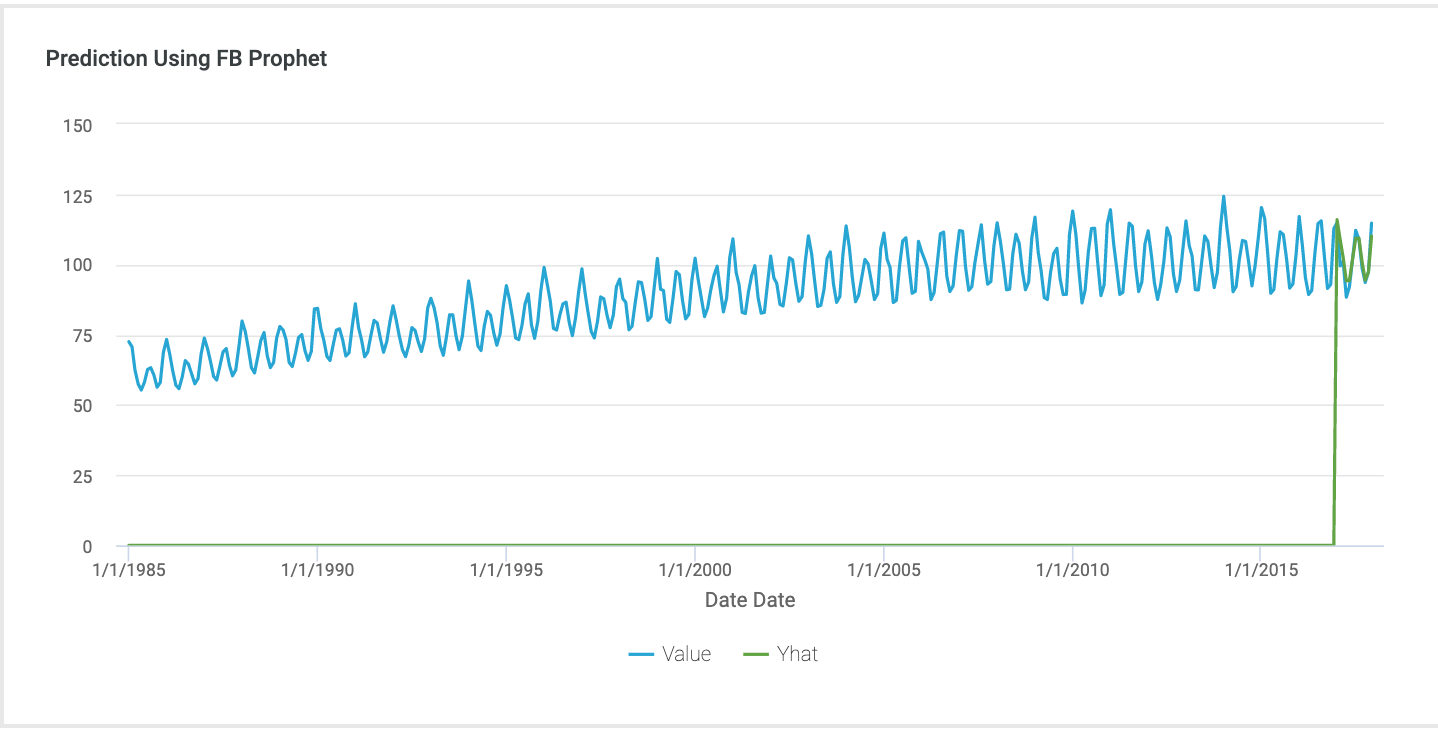
I got the dataset from Kaggle for practicing time series analysis. https://www.kaggle.com/kandij/electric-production The data set used here has 2 columns, one column is the date and the other column relates to the consumption percentage. It includes the data from Dec 31,1984 to Dec 31,2017. For predicting the consumption of electricity in the coming future. I used time series analysis in Incorta notebooks using Facebook Prophet. Here is the result in Incorta. The blue line showing original data, and the green line showing predict electric production.