How to create fiscal calendar in Incorta?(Part 3)

 The third part is the PySpark dataframe, this part is the most challenging part for me. Writing this part with PySpark is simpler and easier since we can get the data we want based on the previous result. For example, fiscal quarter seq and fiscal week of quarter can be built on the top of fiscal quarter number, and so on. I also practice how to use the window function in dataframe. For example, calculating fiscal year end date, fiscal month start date, fiscal month end date, and so on. 

  1. For getting the fiscal quarter number, we can use divide the week of year by 13. 
  2. For getting the fiscal month of quarter, we can depend on the fiscal week of quarter. When fiscal week of quarter <= 4, it is the first month of the quarter, and the month of quarter is 1. When fiscal week of quarter <=4+5, fiscal week of quarter is 2.  When fiscal week of quarter <=4+5+4, fiscal week of quarter is 3. Otherwise, when there are more than 52 weeks in a year, fiscal week of quarter is 3
  3. For getting fiscal year end date, fiscal month start date, fiscal month end date, we can use window function to partition data by fiscal year or fiscal month number to get the maximum or minimum value. 
#When fiscal_week_of_year <= 52, Returns the largest integer not greater than ‘week of year’ Divide by 13, add 1. Otherwise, add 0.
date_range=date_range.withColumn('fiscal_quarter_number', (floor((date_range.fiscal_week_of_year-1)/13)+when(date_range.fiscal_week_of_year <= 52, 1 ).otherwise(0)))
date_range=date_range.withColumn('fiscal_quarter_seq', date_range.fiscal_year_seq*4+date_range.fiscal_quarter_number-1)
date_range=date_range.withColumn('fiscal_week_of_quarter', (date_range.fiscal_week_of_year-((date_range.fiscal_quarter_number-1)*13)))
#When fiscal week of quarter <= 4, it is the first month of the quarter, and the month of quarter is 1.
#When fiscal week of quarter <=4+5, fiscal week of quarter is 2.
#When fiscal week of quarter <=4+5+4, fiscal week of quarter is 3. Otherwise, when there are more than 52 weeks in a year, fiscal week of quarter is 3
date_range=date_range.withColumn('fiscal_month_of_quarter',when((date_range.fiscal_week_of_quarter) <=4,1)
.when((date_range.fiscal_week_of_quarter) <=4+5 , 2)
.when((date_range.fiscal_week_of_quarter) <=4+5+4 , 3)
.otherwise(3)
)
date_range=date_range.withColumn('fiscal_month_number', ((date_range.fiscal_quarter_number-1)*3+(date_range.fiscal_month_of_quarter)))
date_range=date_range.withColumn('fiscal_week_of_month', when((date_range.fiscal_month_of_quarter) ==1,date_range.fiscal_week_of_quarter)
.when((date_range.fiscal_month_of_quarter) ==2 , date_range.fiscal_week_of_quarter-4)
.when((date_range.fiscal_month_of_quarter) ==3 , date_range.fiscal_week_of_quarter-9)
.otherwise('null')
)
date_range=date_range.withColumn('fiscal_month_name' , when(date_range.fiscal_month_number==1,'January')
.when(date_range.fiscal_month_number==2,'February')
.when(date_range.fiscal_month_number==3,'March')
.when(date_range.fiscal_month_number==4,'April')
.when(date_range.fiscal_month_number==5,'May')
.when(date_range.fiscal_month_number==6,'June')
.when(date_range.fiscal_month_number==7,'July')
.when(date_range.fiscal_month_number==8,'August')
.when(date_range.fiscal_month_number==9,'September')
.when(date_range.fiscal_month_number==10,'October')
.when(date_range.fiscal_month_number==11,'November')
.when(date_range.fiscal_month_number==12,'December')
.otherwise('null')
)
date_range=date_range.withColumn('fiscal_month_seq' ,((date_range.fiscal_year*12) + (date_range.fiscal_month_number-1) - (2016*12)))
windowSpecAgg = Window.partitionBy("fiscal_year")
#partitionBy("fiscal_year", "fiscal_month_number"). First, the fiscal year and fiscal month number are sorted and partitioned. The largest date in the column is the fiscal year end date.
date_range=date_range.withColumn("fiscal_year_end_date", max(col("Date1")).over(windowSpecAgg))
windowSpecAgg = Window.partitionBy("fiscal_year", "fiscal_month_number")
date_range=date_range.withColumn("fiscal_month_start_date", min(col("Date1")).over(windowSpecAgg))
windowSpecAgg = Window.partitionBy("fiscal_year", "fiscal_month_number")
date_range=date_range.withColumn("fiscal_month_end_date", max(col("Date1")).over(windowSpecAgg))
windowSpecAgg = Window.partitionBy("fiscal_year", "fiscal_quarter_number")
date_range=date_range.withColumn("fiscal_quarter_start_date", min(col("Date1")).over(windowSpecAgg))
windowSpecAgg = Window.partitionBy("fiscal_year", "fiscal_quarter_number")
date_range=date_range.withColumn("fiscal_quarter_end_date", max(col("Date1")).over(windowSpecAgg))
date_range.registerTempTable("Range_TBL")
df_ago = spark.sql('''
select this_year.*, last_year.Date1 fiscal_year_ago_date, last_quarter.Date1 fiscal_quarter_ago_date
from Range_TBL this_year
left join Range_TBL last_year
on this_year.fiscal_day_of_year = last_year.fiscal_day_of_year
and this_year.fiscal_year = last_year.fiscal_year+1
left join Range_TBL last_quarter
on this_year.fiscal_quarter_seq = last_quarter.fiscal_quarter_seq+1
and this_year.fiscal_week_of_quarter = last_quarter.fiscal_week_of_quarter
and this_year.fiscal_week_number =last_quarter.fiscal_week_number
''')


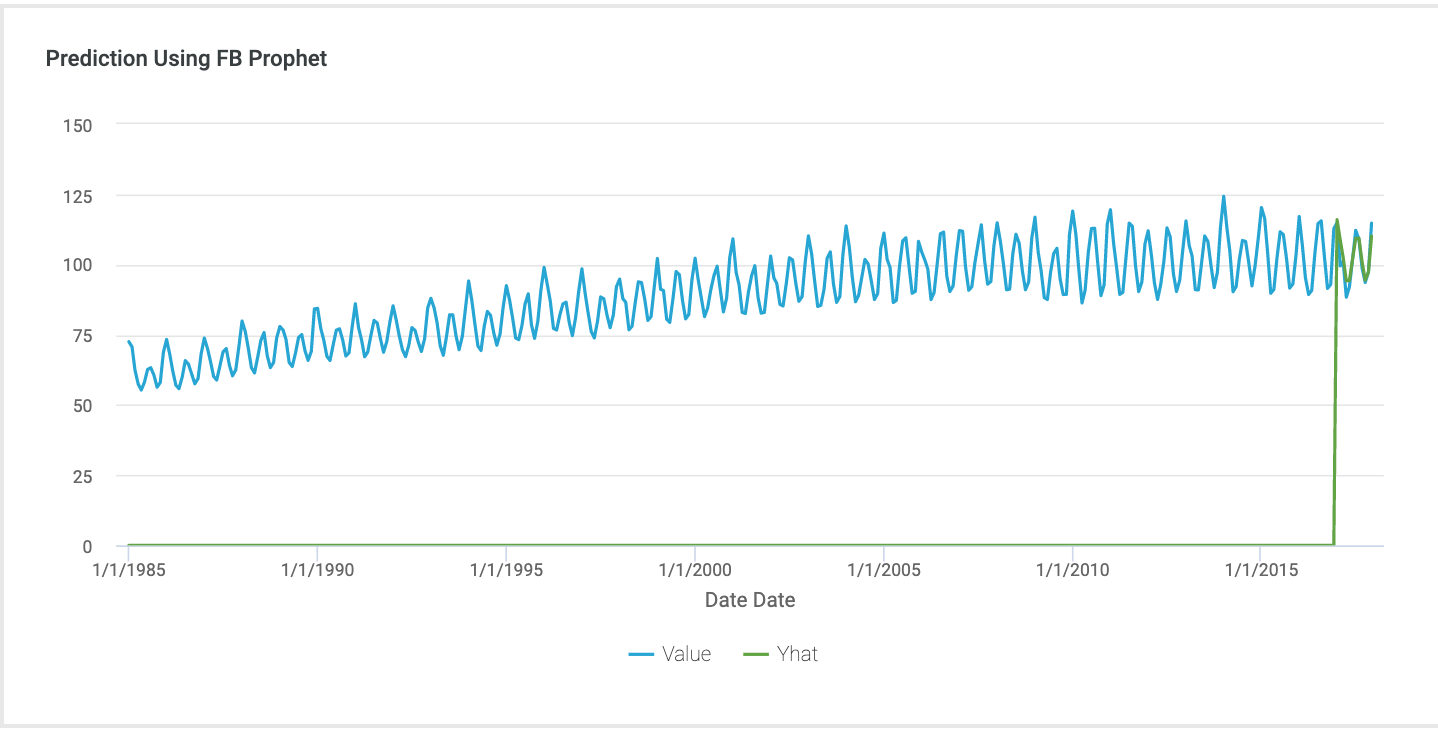
Below is a screenshot of the dashboard in Incorta.


Comments

Popular posts from this blog

How to create histogram in Incorta use bin function.

Using Time Series Analysis Electric Production by ARIMA Model