Using Incorta and PySpark Linear Regression ML package to predict eCommerce Customer
Project Overview
I got a dataset from kaggle.com.
Assumption: eCommerce company based in New York City that sells clothing online but they also have in-store style and clothing advice sessions. Customers come into the store, have sessions or meetings with a personal stylist, then they can go home and order either on a mobile app or website for the clothes they want.
We need to predict 'Yearly Amount Spent'
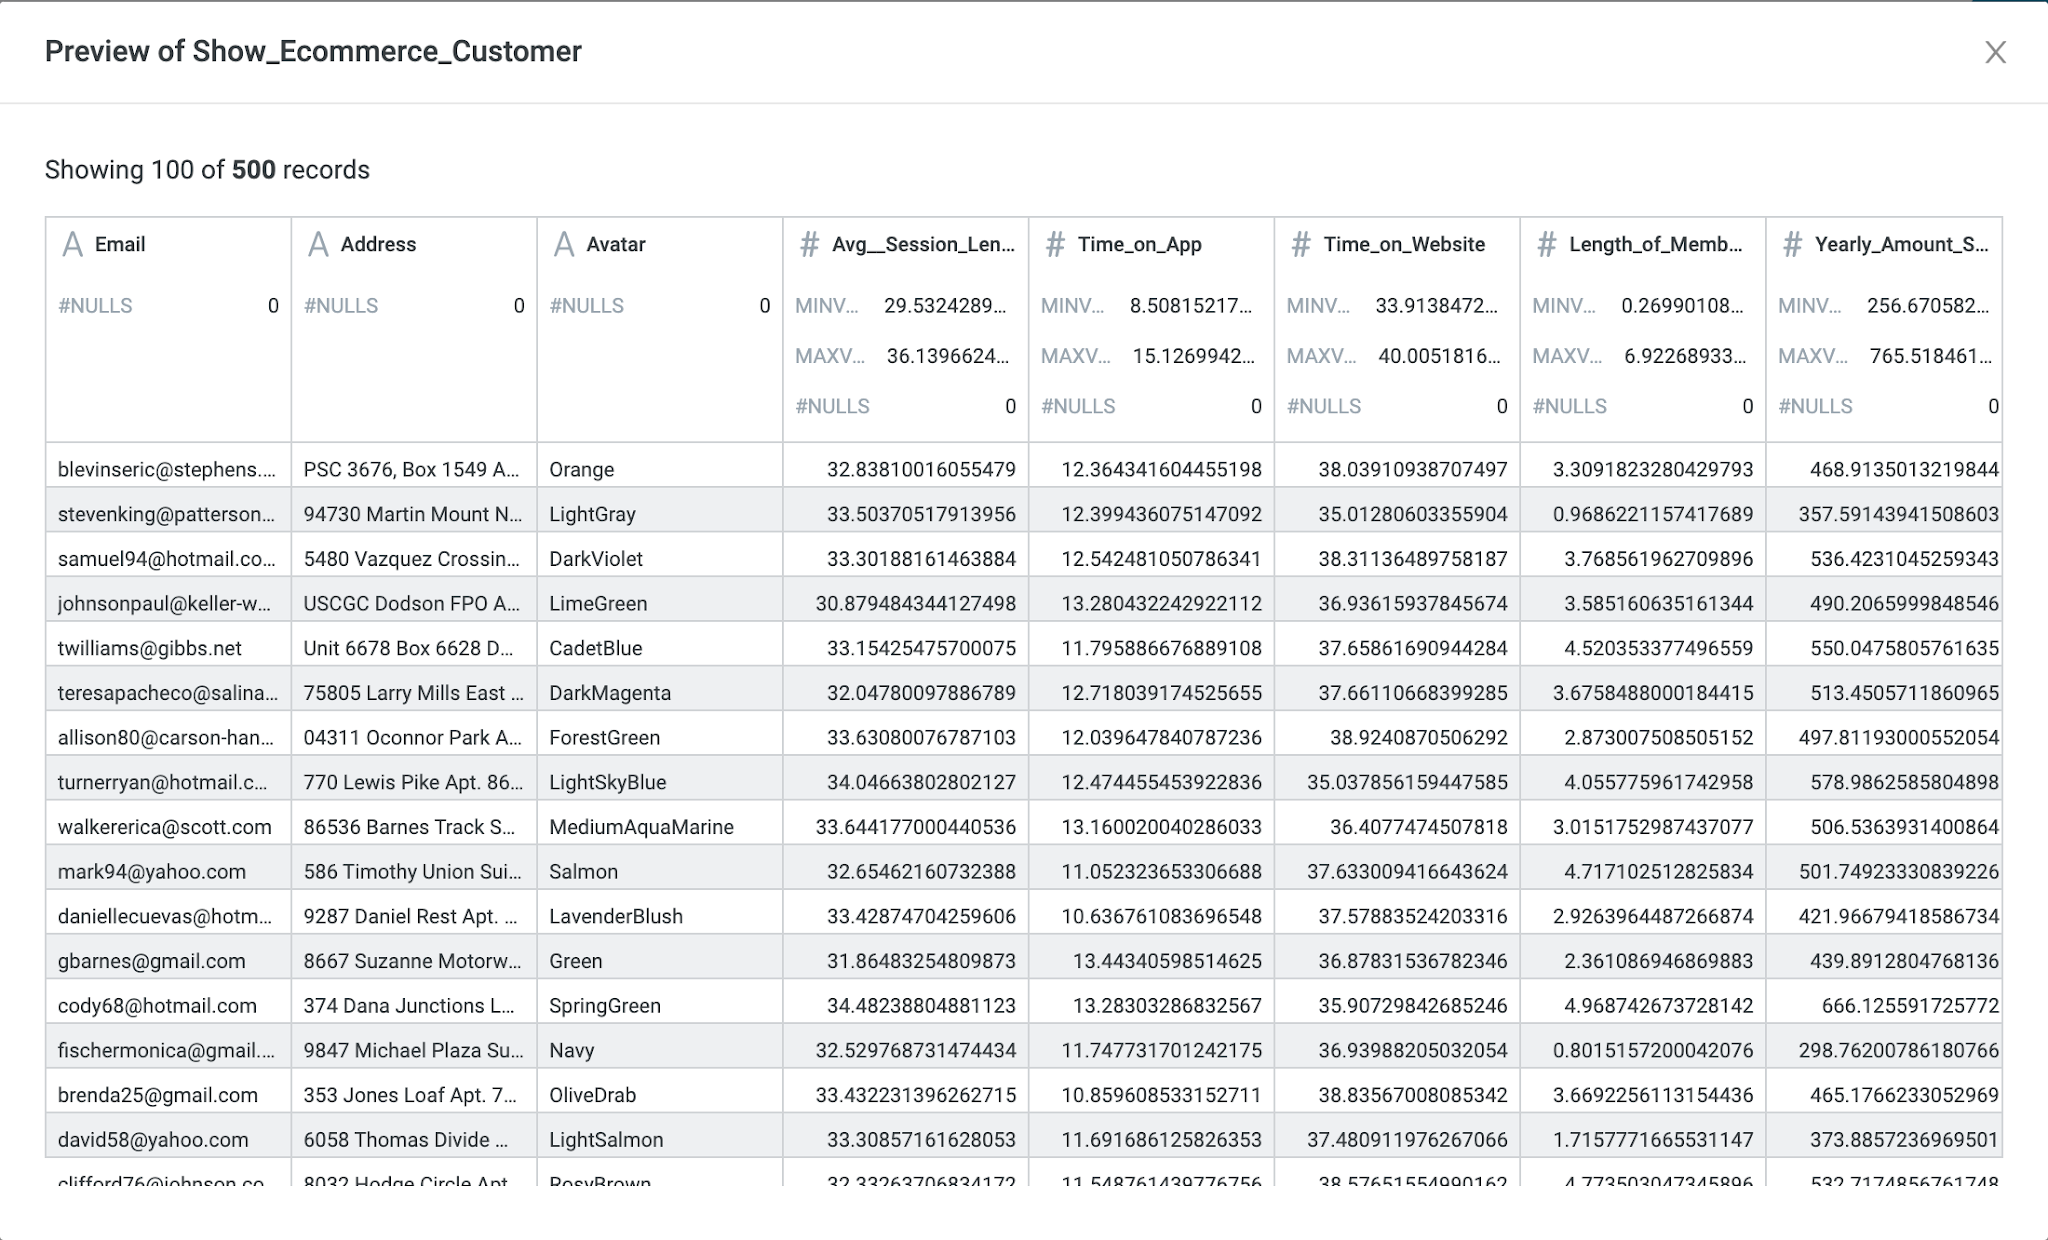
Here are the features or attributes collected in the dataset:
- 'Avg__Session_Length'
- 'Time_on_App'
- 'Time_on_Website'
- 'Length_of_Membership'
Step 1: Upload csv file in incorta.
Upload the CSV file to Incorta, and add a file table in the schema named Ecommerce_Customer.
Step 2: Read the Ecommerce Customer file
Use PySpark to read the table named SparkTesting.Ecommerce_Customer.
The CSV file loaded into Incota can be read into PySpark using
This file contains bidirectional Unicode text that may be interpreted or compiled differently than what appears below. To review, open the file in an editor that reveals hidden Unicode characters.
Learn more about bidirectional Unicode characters
from pyspark.sql import SparkSession | |
spark = SparkSession.builder.appName('lr_example').getOrCreate() | |
from pyspark.ml.regression import LinearRegression | |
df = read("SparkTesting.Ecommerce_Customer") | |
df.printSchema() | |
df.show() | |
save(df) |
Step 3: VectorAssemblerTest
Use VectorAssembler combine 'Avg__Session_Length', 'Time_on_App', 'Time_on_Website' and 'Length_of_Membership' into a single feature vector called 'features'.
This file contains bidirectional Unicode text that may be interpreted or compiled differently than what appears below. To review, open the file in an editor that reveals hidden Unicode characters.
Learn more about bidirectional Unicode characters
from pyspark.ml.linalg import Vectors | |
from pyspark.ml.feature import VectorAssembler | |
from pyspark.ml.regression import LinearRegression | |
df = read("SparkTesting.Ecommerce_Customer") | |
assembler = VectorAssembler(inputCols=['Avg__Session_Length', 'Time_on_App', 'Time_on_Website', 'Length_of_Membership'], outputCol='features') | |
output = assembler.transform(df) | |
output.select('features').show() | |
output.printSchema() | |
save(output) |
Step 4: Split data into Training and Testing data sets
The PySpark randomSplit function randomly samples the data to help ensure that the testing and training sets are similar. I split the data into two sets, 70% used in training, and 30% used in testing.
This file contains bidirectional Unicode text that may be interpreted or compiled differently than what appears below. To review, open the file in an editor that reveals hidden Unicode characters.
Learn more about bidirectional Unicode characters
output = assembler.transform(df) | |
final_data = output.select('features', 'Yearly_Amount_Spent') | |
train_data,test_data = final_data.randomSplit([0.7,0.3]) |
Step 5: Train data
I use PySpark LinearRegression to train a linear regression model and extract model summary statistics.
This file contains bidirectional Unicode text that may be interpreted or compiled differently than what appears below. To review, open the file in an editor that reveals hidden Unicode characters.
Learn more about bidirectional Unicode characters
lr = LinearRegression(labelCol='Yearly_Amount_Spent') | |
lr_model = lr.fit(train_data) | |
print("Coefficients: " + str(lr_model.coefficients)) | |
print("Intercept: " + str(lr_model.intercept)) | |
lr_model.write().overwrite().save("models/Ecommerce_Customer_001") | |
trainingSummary = lr_model.summary | |
print("numIterations: %d" % trainingSummary.totalIterations) | |
print("objectiveHistory: %s" % str(trainingSummary.objectiveHistory)) | |
trainingSummary.residuals.show() | |
print("RMSE: %f" % trainingSummary.rootMeanSquaredError) | |
print("r2: %f" % trainingSummary.r2) |
Step 6: Test model
For evaluating the linear regression model, I used 30% of data as testing data and used RMSE and R2 to evaluate the model.
This file contains bidirectional Unicode text that may be interpreted or compiled differently than what appears below. To review, open the file in an editor that reveals hidden Unicode characters.
Learn more about bidirectional Unicode characters
test_results = lr_model.evaluate(test_data) | |
test_results.residuals.show() | |
test_results.predictions.show() | |
print("RMSE = %s" % test_results.rootMeanSquaredError) | |
print("R2 = %s" % test_results.r2) |
Step 7: Prediction
The final product is the model that we can use for predicting 'Yearly_Amount_Spent' for unlabeled data.
This file contains bidirectional Unicode text that may be interpreted or compiled differently than what appears below. To review, open the file in an editor that reveals hidden Unicode characters.
Learn more about bidirectional Unicode characters
df_testing=read("SparkTesting.Testing_Data") | |
unlabeled_data = df_testing.select('features') | |
unlabeled_data.show() | |
from pyspark.ml.regression import LinearRegressionModel | |
lr_model = LinearRegressionModel.load("models/Ecommerce_Customer_001") | |
predictions = lr_model.transform(unlabeled_data) | |
predictions.show() | |
save(predictions) |
Thank you for sharing the post keep posting growth partner ecommerce if you looking to start your own ecommerce business.
ReplyDelete