Posts

Showing posts with the label PySpark

Using Github to version and manage notebooks(Jupyter notebooks)

Image
Version Control and Manage is a vital part of data science workflows. Between multiple experiments, it is essential to know what changed and which updates were made by which team member. We can use Github to version and manage notebooks(Jupyter notebooks) following the below steps.  Step 1: Go to the Incorta environment at the terminal.  $ ssh -i <key file> incorta@<IP address> Step 2: Find Jupyter file path follow below command: $ cd / $ find . -name '*.ipynb' -print We can see the Jupyter notebooks file path is /home/incorta/Notebooks Step 3: Go to Github, create a new repository.  Step 4: Then clone this link under the Notebooks directory. $ git clone https://github.com/SuzieJi/Jupyter-Notebooks We can see the folder in Jupyter notebooks. Step 5: Go to the git repository directory that we cloned from Github.  $ cd < directory >/ Git config (When the first time) $ git config --global user.name "xxx" $ git config --global user.email "xxxxx...
How to do data profiling in Incorta

Image
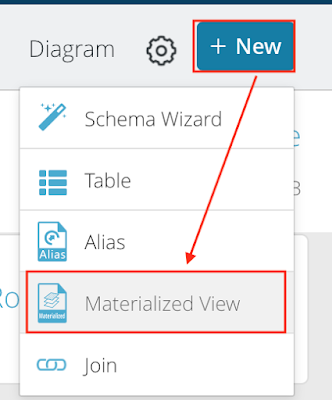
Sometimes we need to better upstanding about data, we can do data profiling using Spark Python in Incorta. Firstly, Add a new Materialized View in Incorta. Select Spark Python. Then, I have two methods do data profiling. Method 1: Using df.describe()  This function can provide min, max, count, mean, stddev. But only for data types of string and number.  Method 2: Calculate each metric ourselves.  Below is the syntax:  

Using Incorta and PySpark Linear Regression ML package to predict eCommerce Customer

Image
Project Overview I got a dataset from  kaggle.com .  Assumption: eCommerce company based in New York City that sells clothing online but they also have in-store style and clothing advice sessi ons. Customers come into the store, have sessions or meetings with a personal stylist, then they can go home and order either on a mobile app or website for the clothes they want. We need to predict 'Yearly Amount Spent' Here are the features or attributes collected in the dataset: 'Avg__Session_Length' 'Time_on_App' 'Time_on_Website' 'Length_of_Membership' Step 1: Upload csv file in incorta. Upload the CSV file to Incorta, and add a file table in the schema named Ecommerce_Customer. Step 2: Read the Ecommerce Customer file Use PySpark to read the table named SparkTesting.Ecommerce_Customer. The CSV file loaded into Incota can be read into PySpark using  df=read("SparkTesting.Ecommerce_Customer") Step 3: VectorAssemblerTest Use...

Using PySpark to calculate Orders and Promotion in Incorta

Image
First of all, I have an OnlineBookStore database. I have Orderitems and Promotion tables. Orderitems Table: Promotion Table: I want to calculate the total price of each order from the Orderitems table. Then compare with promotion and find the corresponding gift. So I used PySpark calculate Order Amount in Incorta. OrderAmount Table:

My first incorta materialized view

Image
I found that incorta allows me to practice my PySpark skills. This is my first MV.  The PythonListTable will look like below.