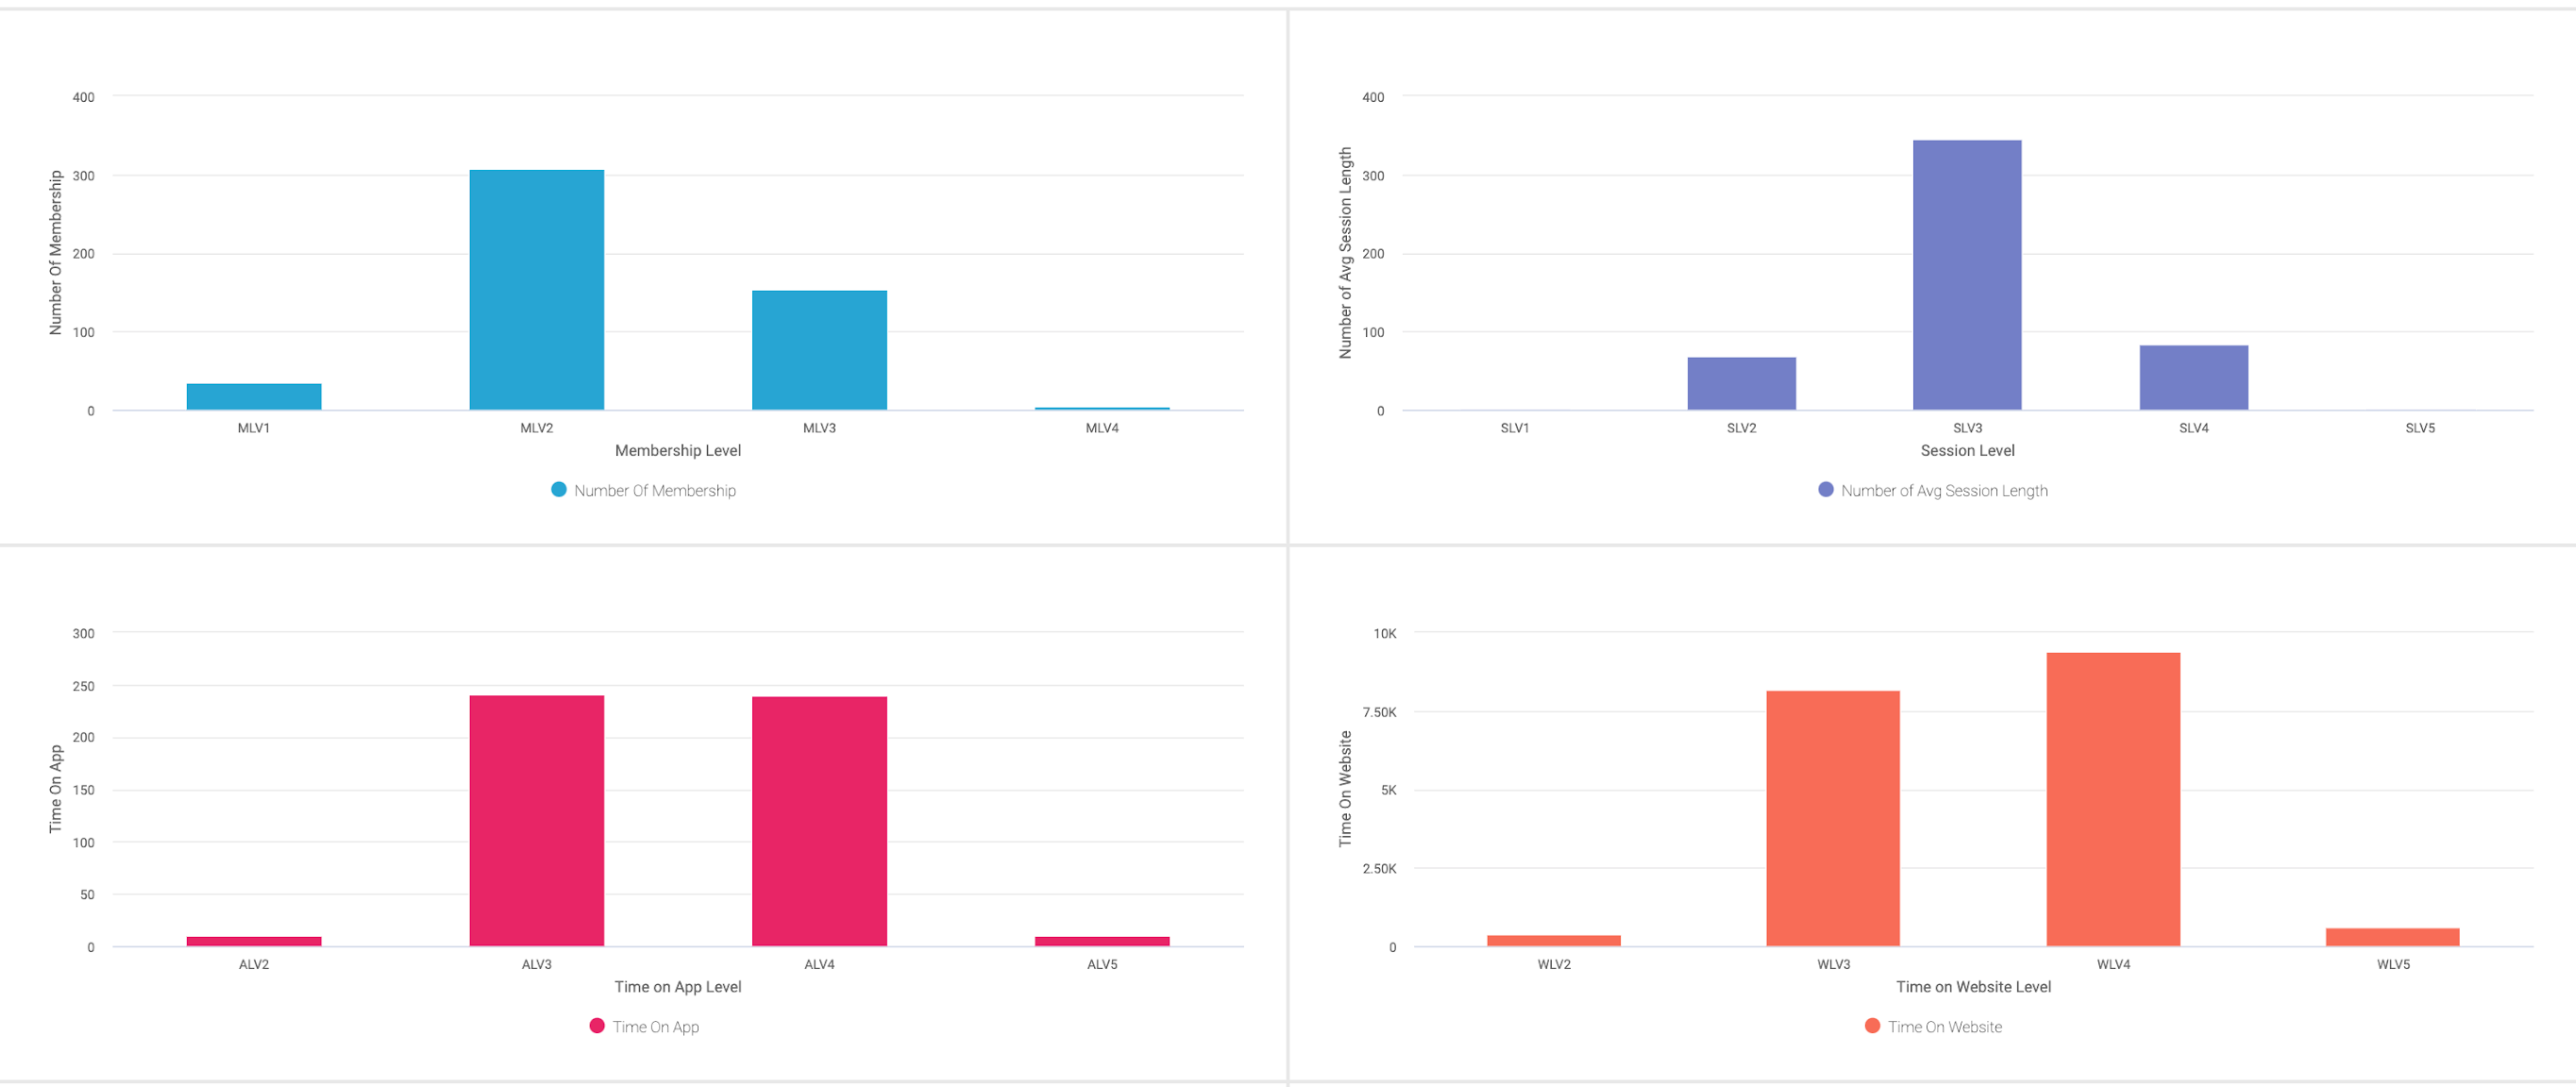
How to create histogram in Incorta use bin function.
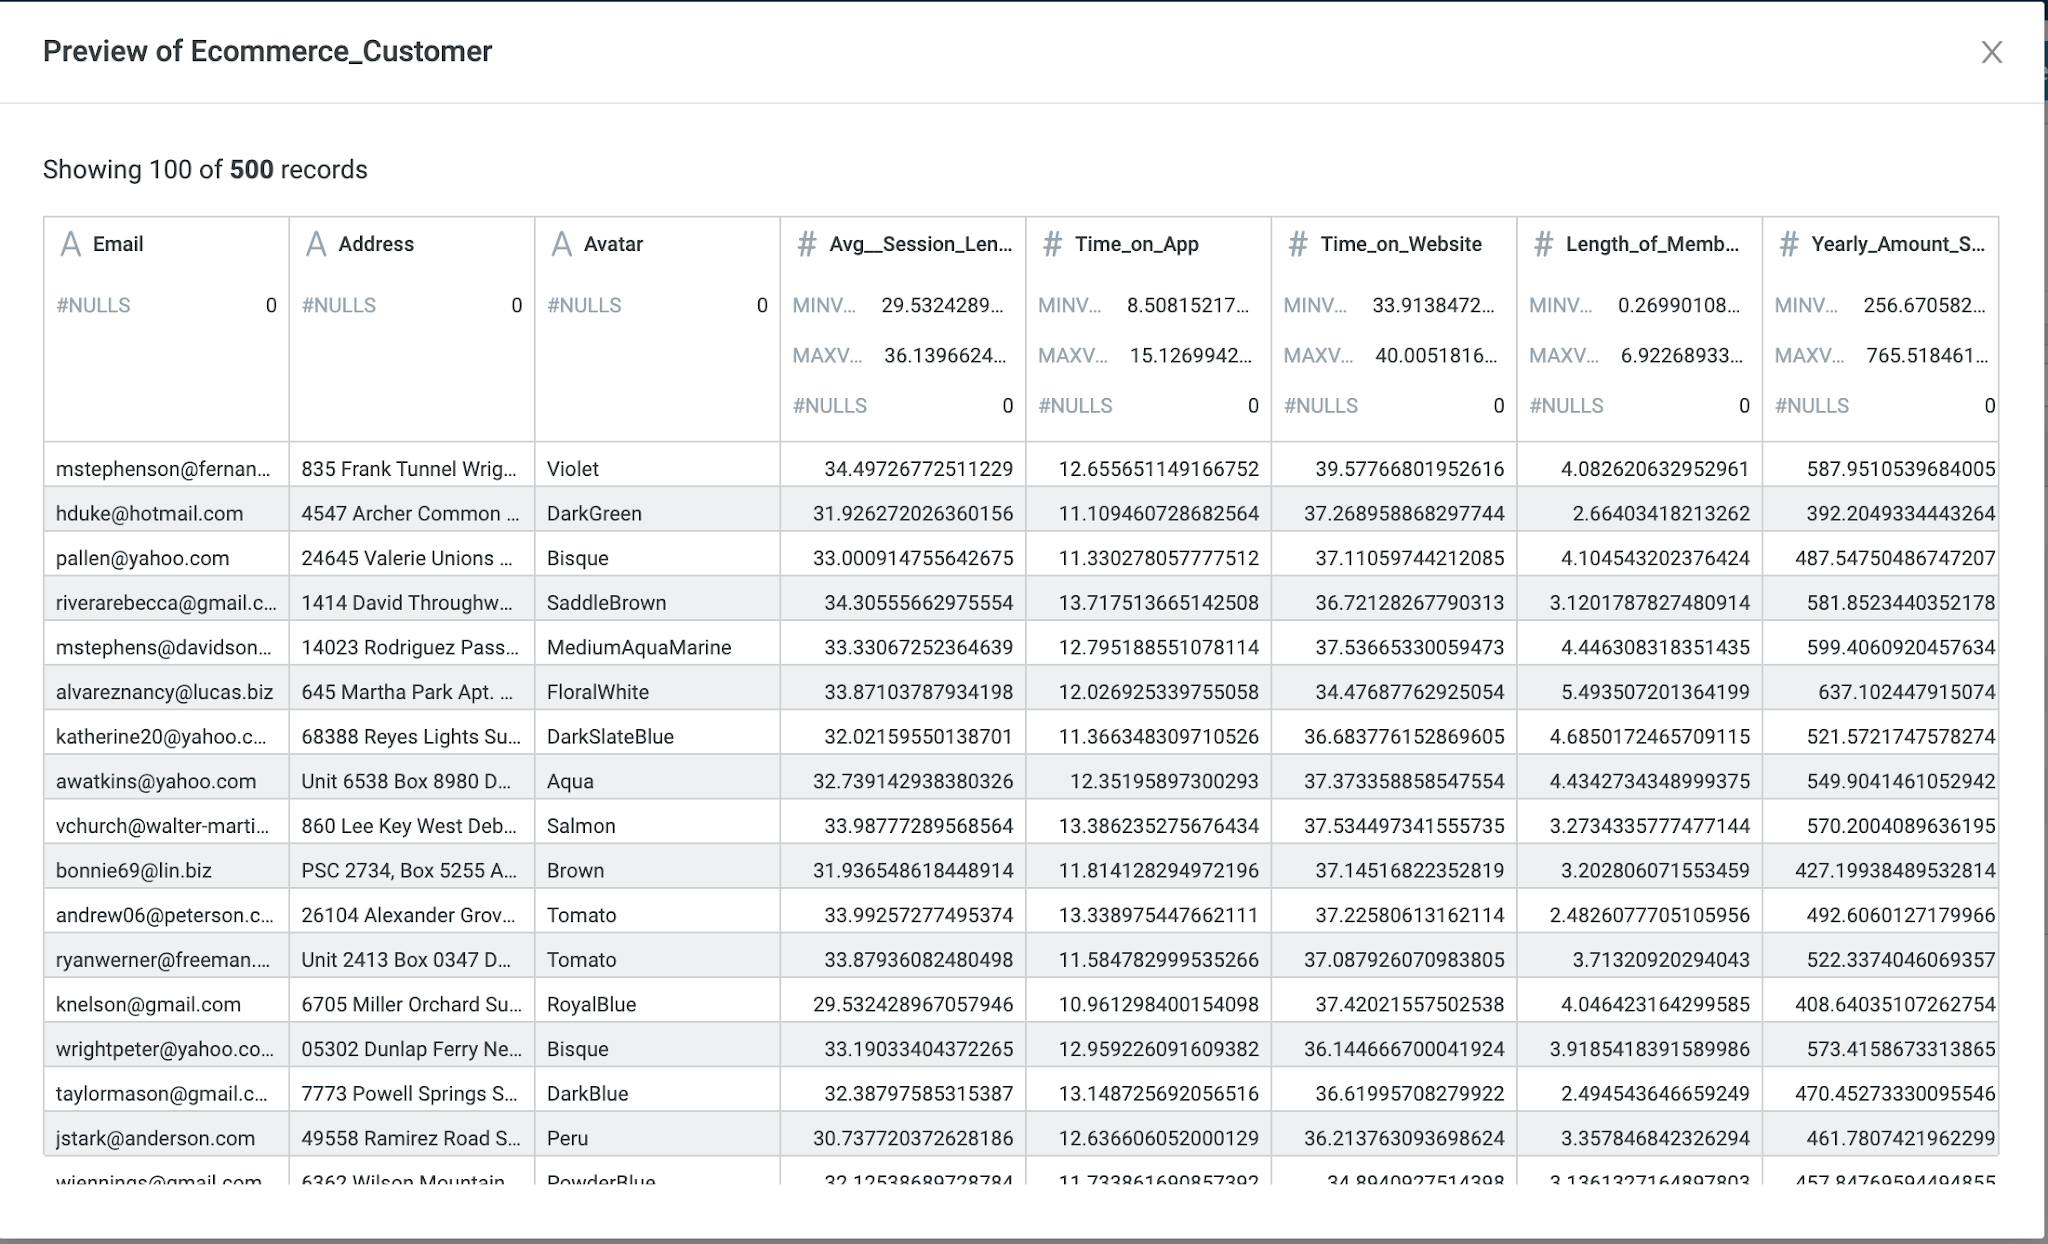
The Ecommerce_Customer schema has four variables, Time On App, Time On Website, Length Of Membership, and Yearly Amount Spent. I want to see the distribution of these data. Incorta let me preview the data and show max and min data of each using its Preview function.
Here are the steps I used to create a histogram in Incorta.
First, I used the bin function in Incorta divided into different levels.
Here is the documentation for the bin function. https://docs.incorta.com/4.5/r-bin
Here is the result of the bin function. I divided the average of session length into 6 levels. If the length is less than 30, it will be labeled as 'SLV1', and if the length is greater than 30 but less than 32, it will be labeled as 'SLV2', by basically, according to the min and max value. I see the minimum value is close to 30, and the maximum value close to 38. I decided to use 2 minutes as the interval and created the formula using the bin function.


Nice job!
ReplyDelete