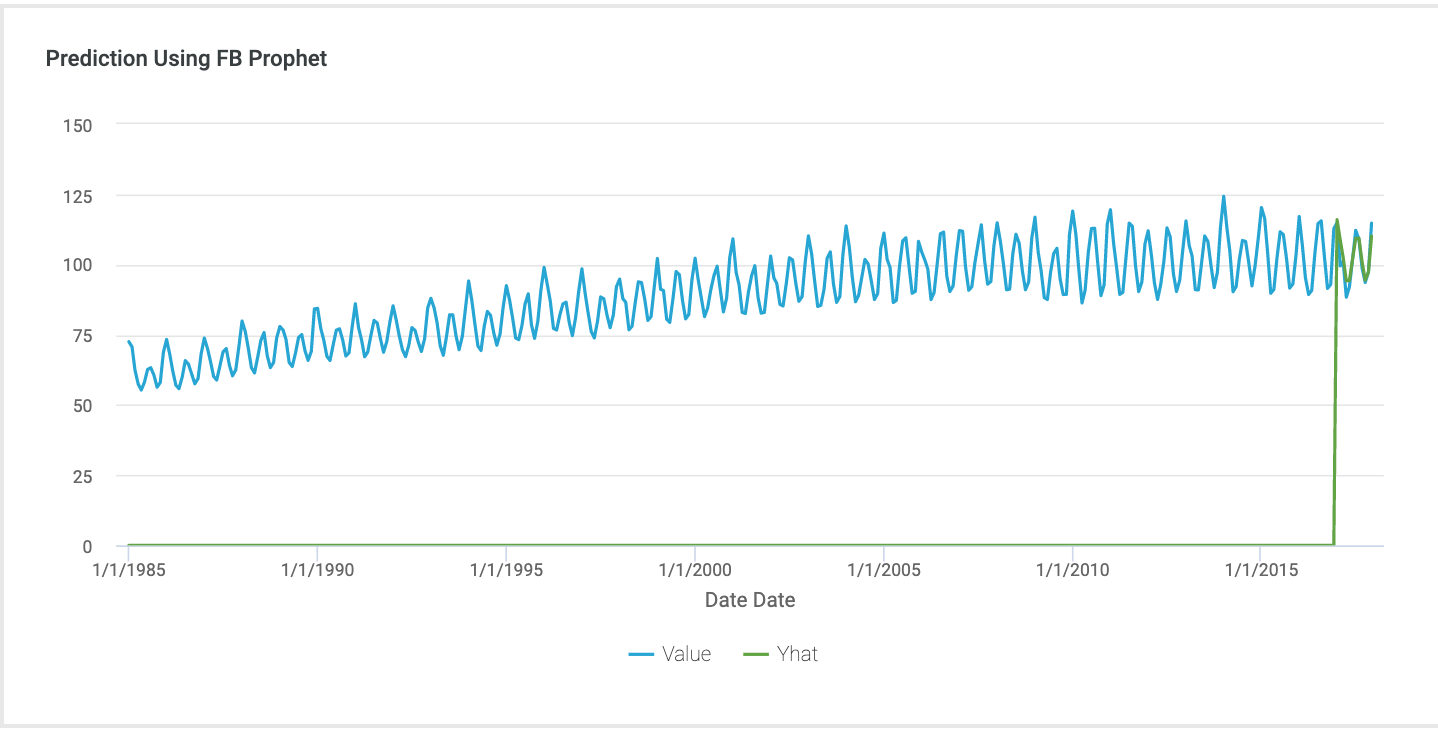
I got the dataset from Kaggle for practicing time series analysis. https://www.kaggle.com/kandij/electric-production The data set used here has 2 columns, one column is the date and the other column relates to the consumption percentage. It includes the data from Dec 31,1984 to Dec 31,2017. For predicting the consumption of electricity in the coming future. I used time series analysis in Incorta notebooks using Facebook Prophet. Here is the result in Incorta. The blue line showing original data, and the green line showing predict electric production.
In the previous blog, I was Using Time Series Analysis By Prophet. https://suziepyspark.blogspot.com/2021/03/using-time-series-analysis-by-prophet.html In this blog, I will use Pickle to Save and use the model in Incorta. In machine learning, we often need to store the trained model so that we can directly read the model when making a decision without retraining the model, which greatly saves time. The pickle module provided by Python solves this problem well. It can serialize objects and save them to disk and read them out when needed. Any object can be serialized. Below is how to use the model: Below is how to save the model: Reference: "Pickle Serialization Study Notes - Programmer Sought". Programmersought.Com, 2021, https://www.programmersought.com/article/15805994125/. "Save Model For Python · Issue #725 · Facebook/Prophet". Github, 2021, https://github.com/facebook/prophet/issues/725.


Comments
Post a Comment