Using time series analysis (Part 1)

I got the dataset from Kaggle for practicing time series analysis. 

 https://www.kaggle.com/felixzhao/productdemandforecasting  

This dataset includes historical product demand by products and warehouses between 2011 and 2017. I loaded data into Incorta, and use the Incorta API to read the data. 


I first did data profiling to summarize the data. I found the data can be categorized by product code, warehouse, and product category. I plan to find the time series based on different product categories and warehouses. 


It was quite challenging to use pandas time series related functions. I need to define the index on a DateTime field, but I can not directly use the date or timestamp field from Spark. Finally, It worked after I use a string field and cover it to date time with Pandas. 
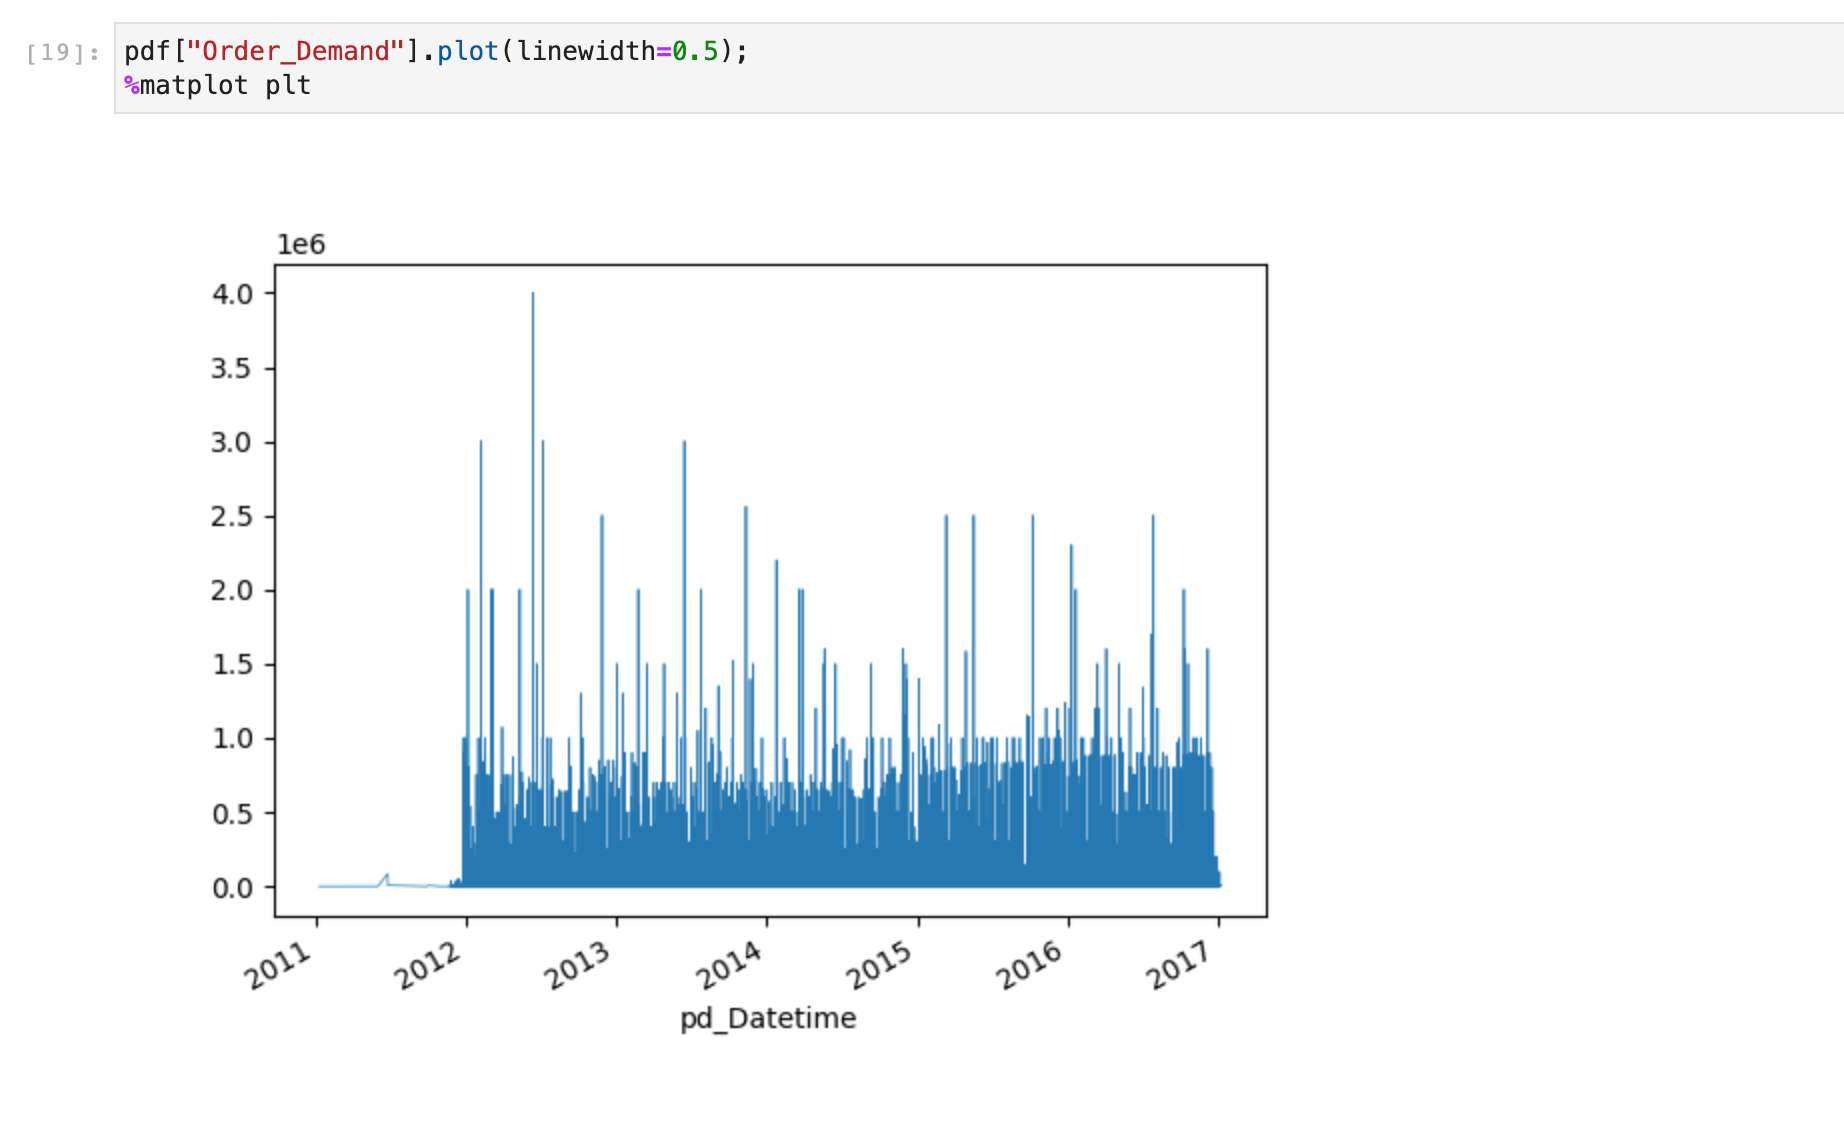
If we don't consider product categories, it does not look like we have time series pattern or trend. 


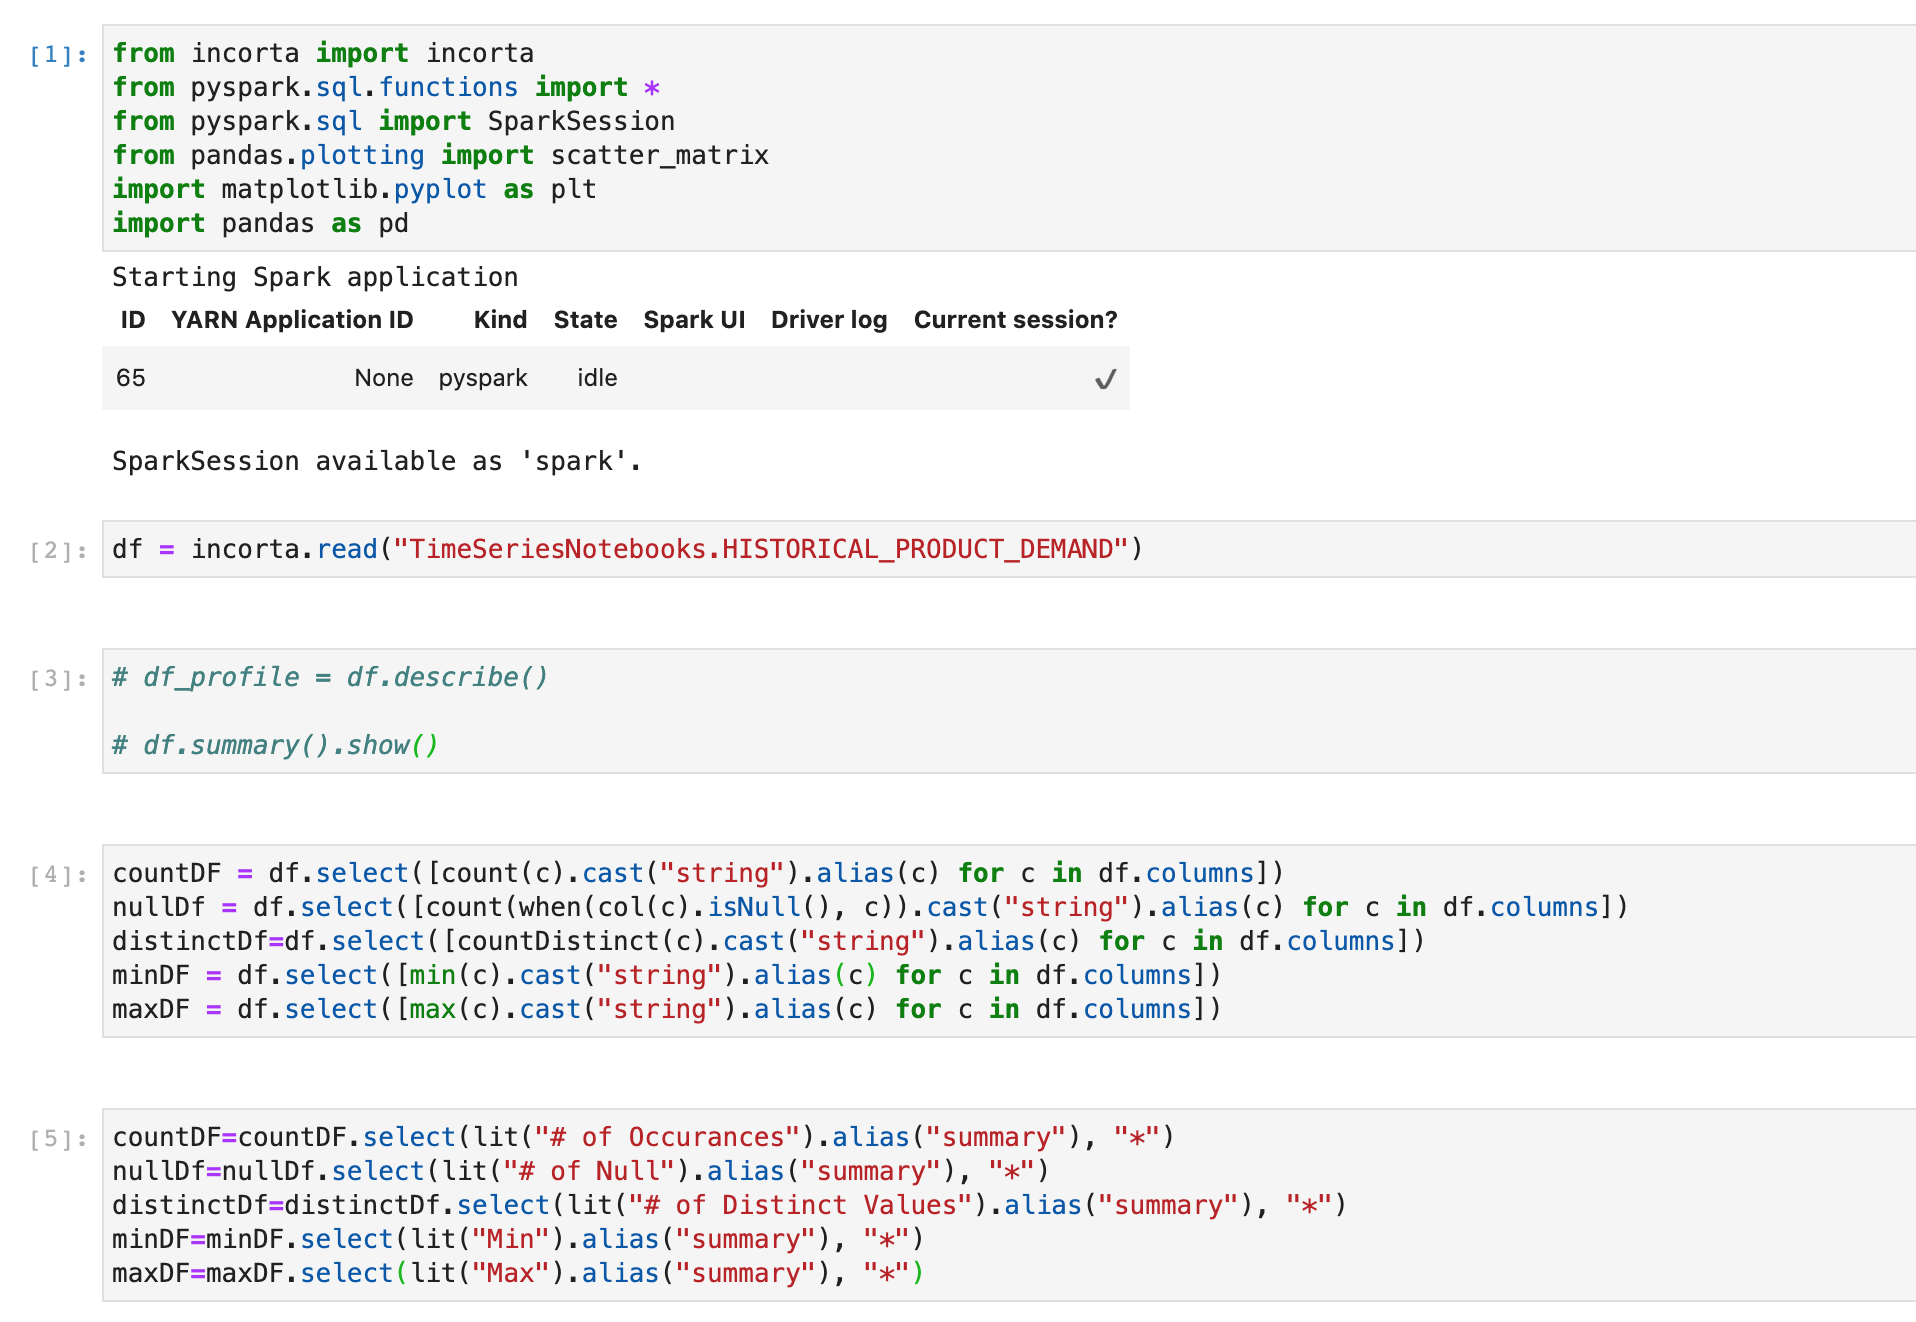
from incorta import incorta
from pyspark.sql.functions import *
from pyspark.sql import SparkSession
from pandas.plotting import scatter_matrix
import matplotlib.pyplot as plt
import pandas as pd
df = incorta.read("TimeSeriesNotebooks.HISTORICAL_PRODUCT_DEMAND")
# df_profile = df.describe()
# df.summary().show()
countDF = df.select([count(c).cast("string").alias(c) for c in df.columns])
nullDf = df.select([count(when(col(c).isNull(), c)).cast("string").alias(c) for c in df.columns])
distinctDf=df.select([countDistinct(c).cast("string").alias(c) for c in df.columns])
minDF = df.select([min(c).cast("string").alias(c) for c in df.columns])
maxDF = df.select([max(c).cast("string").alias(c) for c in df.columns])
countDF=countDF.select(lit("# of Occurances").alias("summary"), "*")
nullDf=nullDf.select(lit("# of Null").alias("summary"), "*")
distinctDf=distinctDf.select(lit("# of Distinct Values").alias("summary"), "*")
minDF=minDF.select(lit("Min").alias("summary"), "*")
maxDF=maxDF.select(lit("Max").alias("summary"), "*")
df_output = nullDf.unionAll(distinctDf).unionAll(countDF).unionAll(minDF).unionAll(maxDF)
df_output.show()
# df_profile.show()
df.schema
df = df.withColumnRenamed("Date", "Order_Date")
df = df.select(date_format(col("Order_Date"),'yyyy-MM-dd').alias("Order_Date_Str"),col("Order_Demand"))
df.schema
pdf = df.toPandas()
# pdf.tail()
# pdf.head(3)
pdf.dtypes
pdf['pd_Datetime'] = pd.to_datetime(pdf['Order_Date_Str'] + ' 00:00:00')
pdf.dtypes
pdf = pdf.set_index(pd.DatetimeIndex(pdf['pd_Datetime']))
pdf.head(3)
pdf["Order_Demand"].plot(linewidth=0.5);
%matplot plt

Comments

Popular posts from this blog

How to create histogram in Incorta use bin function.

Using Time Series Analysis Electric Production by ARIMA Model